Linux mytop is a command-line tool that allows you to monitor the performance of MySQL or MariaDB servers. It displays various statistics such as queries per second, slow queries, threads, uptime, and more. It also lets you execute commands on the server without leaving the tool. Mytop is similar to the top utility that shows the CPU usage of processes and can also help you identify and troubleshoot issues with your database server, such as high load, slow queries, or configuration errors.
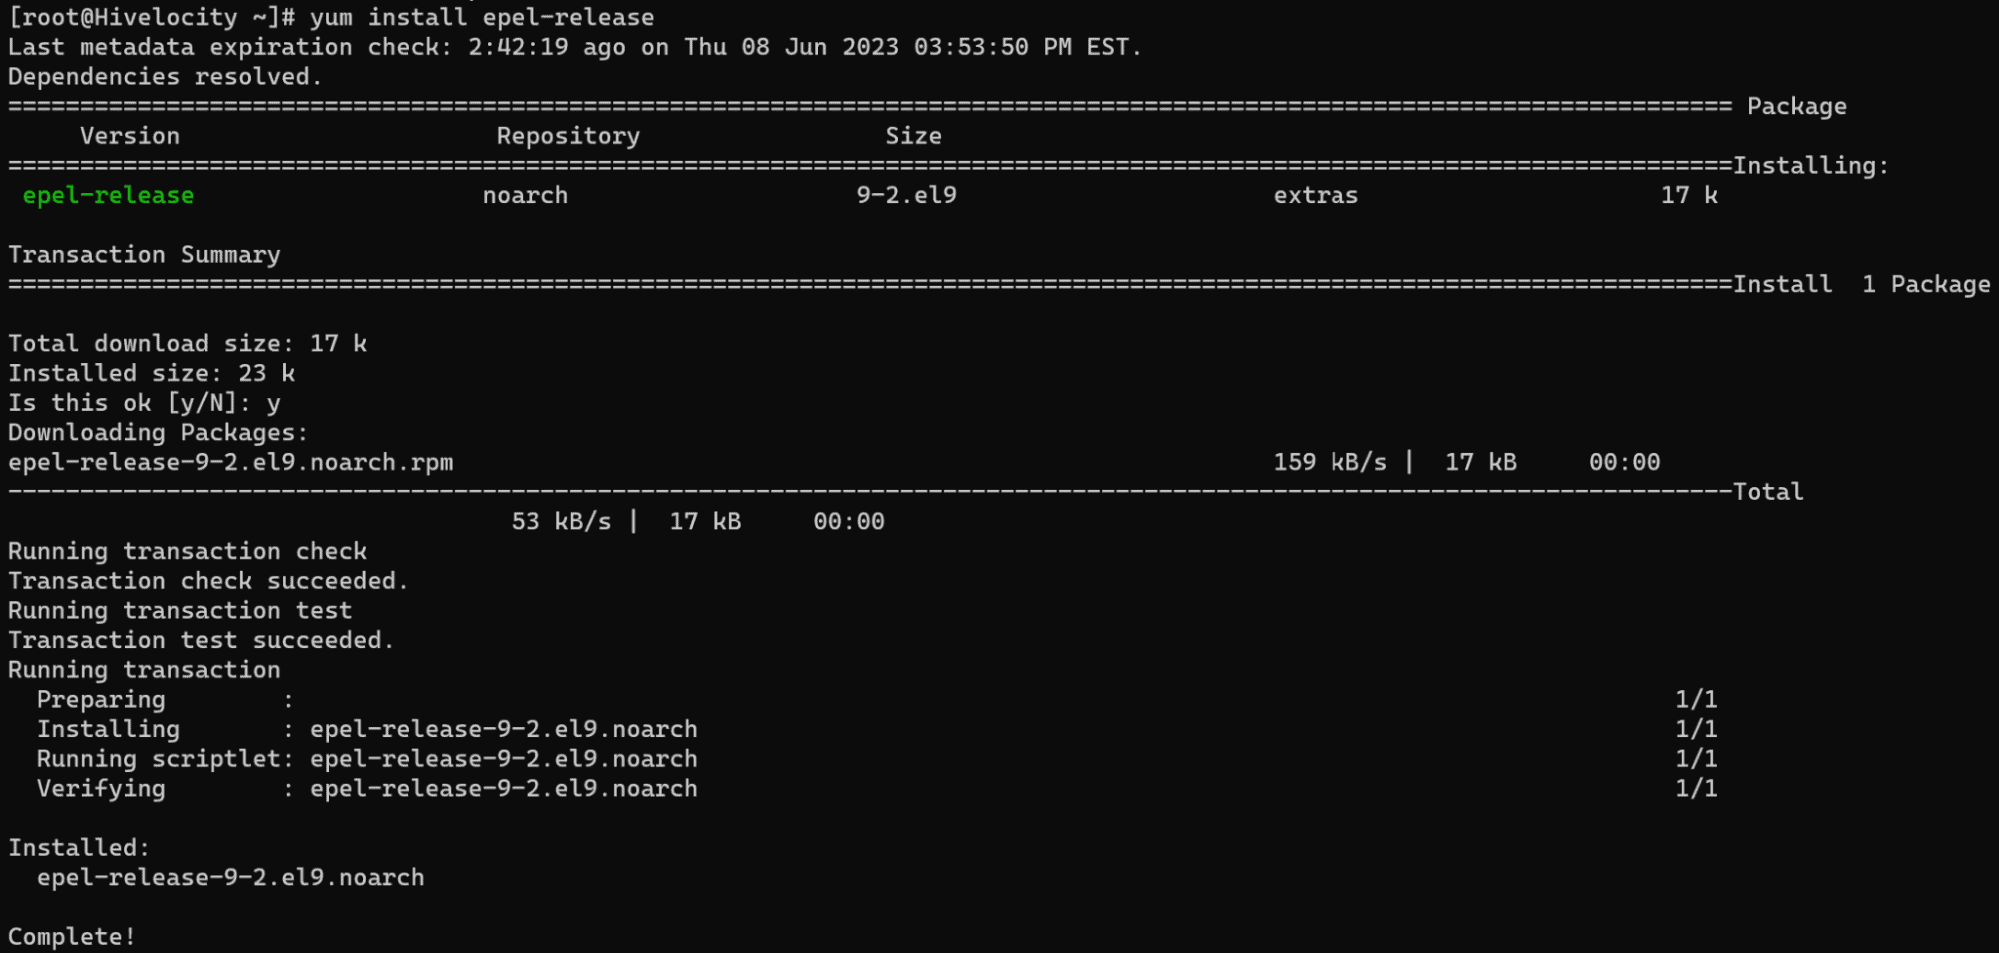
Installing the mytop package requires the installation of the epel-release repository using the following command.
yum install epel-release

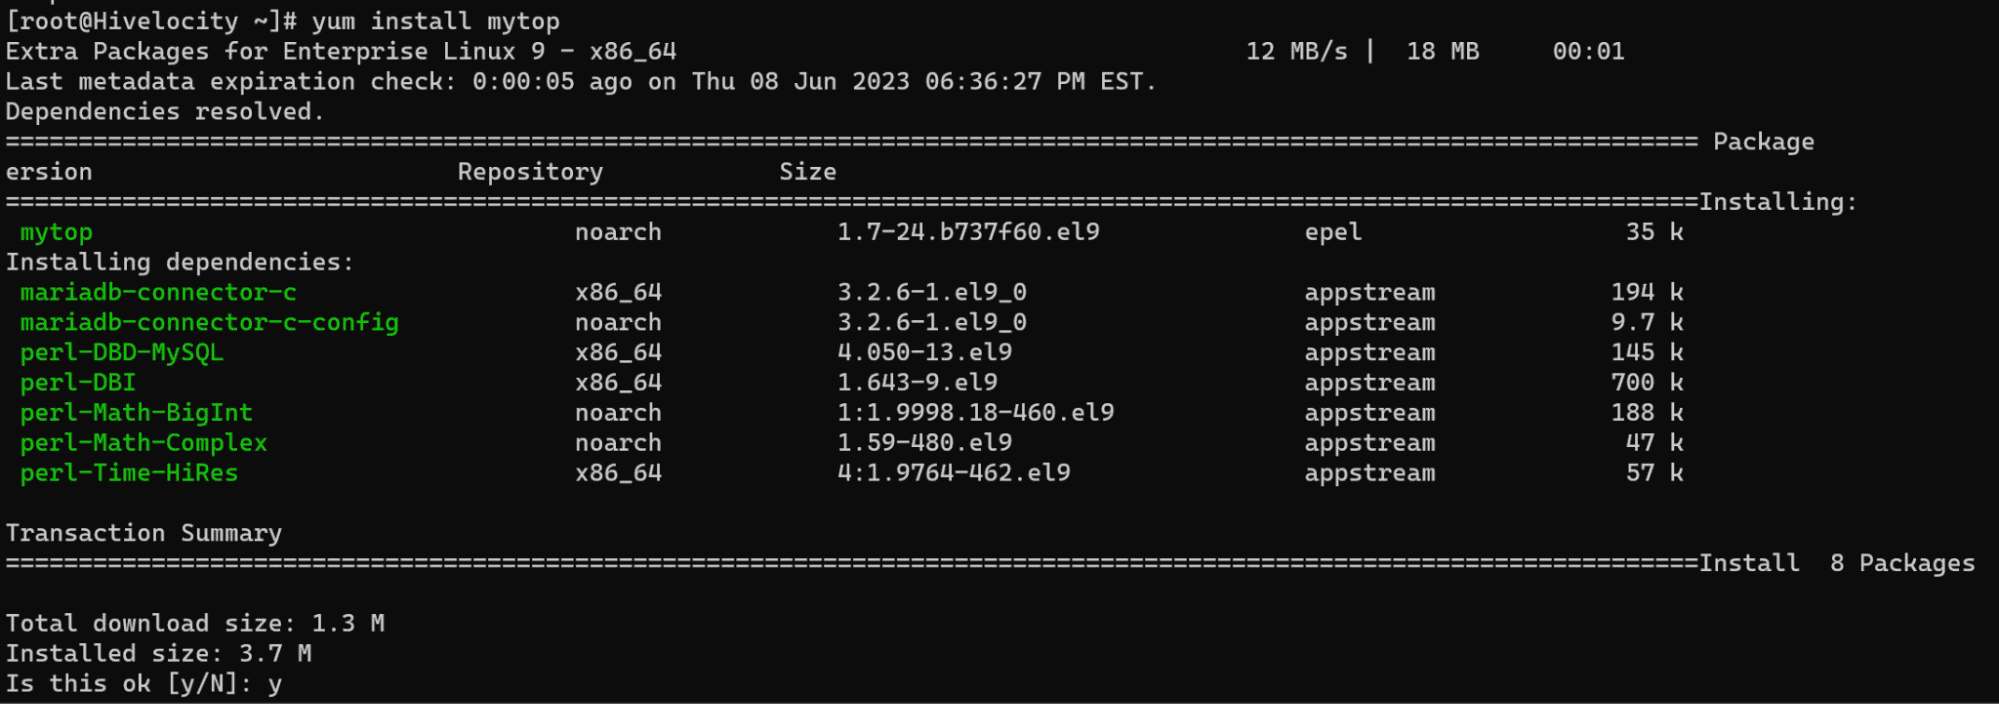
Followed by installing the package itself from the new repository.
yum install mytop

To run the application, type mytop in the command line interface. To view the manual for the application use man mytop.
Finally, here are some of the top commands for mytop:
| ? |
Displays the help screen |
| q | Quits mytop |
| f |
Allows you to select which fields to display |
| n |
Allows you to change the number of seconds between updates |
| m |
Toggles between showing queries and threads |
| s |
Allows you to sort by a specific column |
| i | Toggles the display of idle threads |
| a | Toggles the display of all threads |