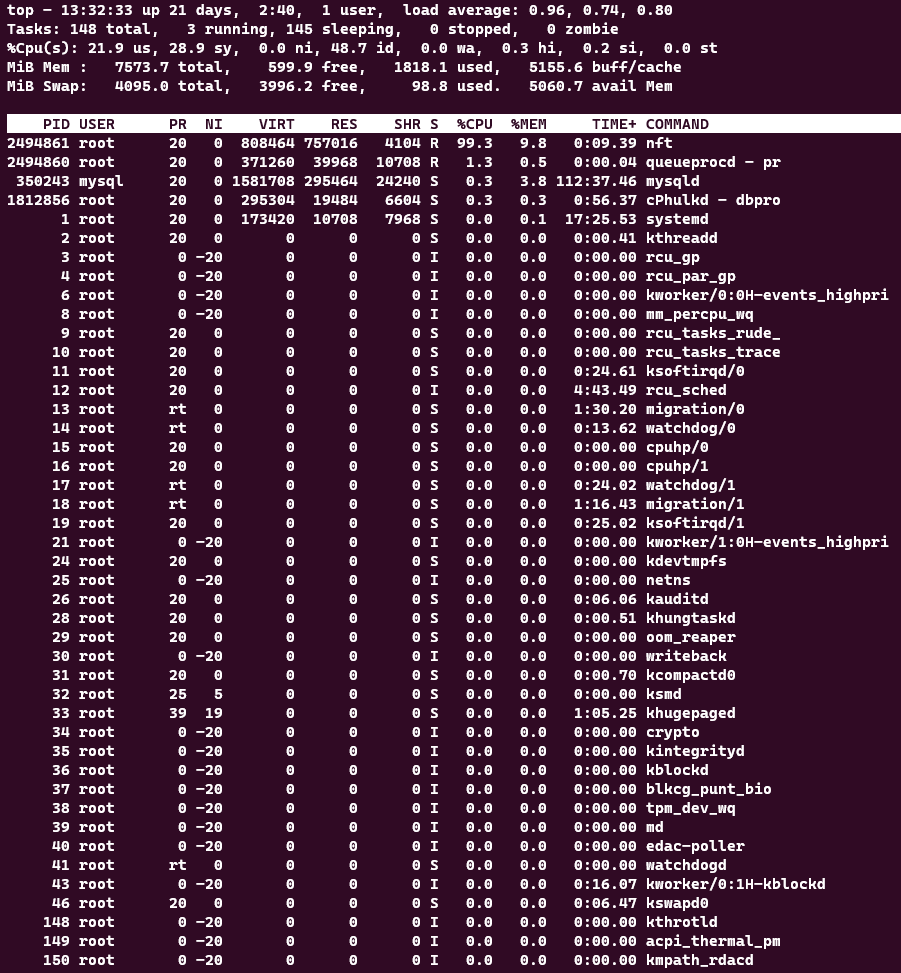
The Linux top command is a useful tool for monitoring system performance and resource usage. It shows a table of processes and their CPU, memory, and other statistics in real-time. You can use various options and keystrokes to customize the output of top and sort the processes by different criteria. The top command also displays a summary of system information, such as uptime, load average, and number of users.
The display is divided into two sections. The upper section contains information related to overall system status — uptime, load average, process counts, CPU status, and utilization statistics for both memory and swap space. The lower section displays process-level statistics. It is possible to change what is displayed while top is running.
Here are some of the most common commands when using top:
- Pressing ‘q’ will exit the top command.
- Pressing ‘k’ will prompt you to enter a PID (Process ID) to kill.
- Pressing ‘r’ will prompt you to enter a PID and then change the priority of that process.
- Pressing ‘f’ will prompt you to enter a field number to sort by.
- Pressing ‘u’ will prompt you to enter a username and then only show processes for that user.
- Pressing ‘i’ will toggle whether idle processes are displayed or not.
